Ruby Childs expands on her experience with Data Physicalisation, a key element in her Maker in Residence project here at Machines Room, and surveys some Data Physicalisation projects which inspire her.
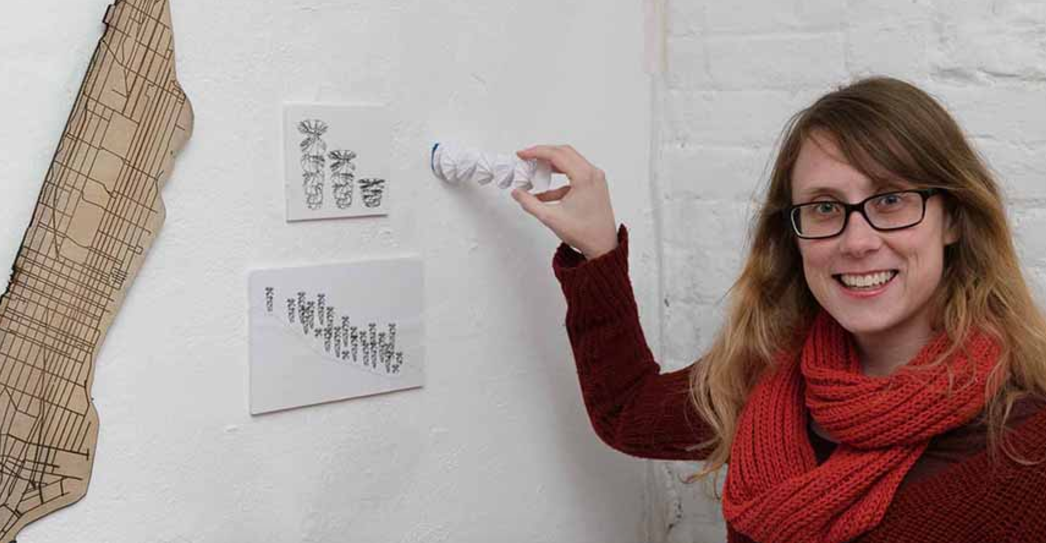
Data Physicalisation is the process of representing data in the physical world. We’ve seen a wealth of techniques in fabrication, interfaces and responsive displays to represent such data. It goes beyond traditional visualisation processes, which are often static. Why do we need to Physicalise Data? Right now, the world has an overload of data. The issue is that the data is not always good quality. Anyone working with data will tell you, its better to have a smaller, high quality dataset than one with volume and of poor quality. Computers process terabytes of data per day, with a lot discarded. But with this volume, we do need understanding. We as data users do not even know what data is being used and tracked. Every click on that website, every purchase, even our daily walks in local neighbourhoods are being recorded by CCTV. Yet data is determining our choices before we have even made them. It is shaping our world, what we do, how we act.
As a Data Scientist myself, I actually play with the data, I obtain these insights and shape the way people experience their data, even if unknowing. But many forget this data is being generated by our actions. We as a society have become disconnected with data in a time when the world is using it most. Data is seen as streams of numbers, in the so-called “cloud”. But adding a physical interface to data allows it to become tangible. This brings me onto Data Physicalisation: the aim to help people explore, understand and communicate their data.
Examples of other Data Physicalisation projects:
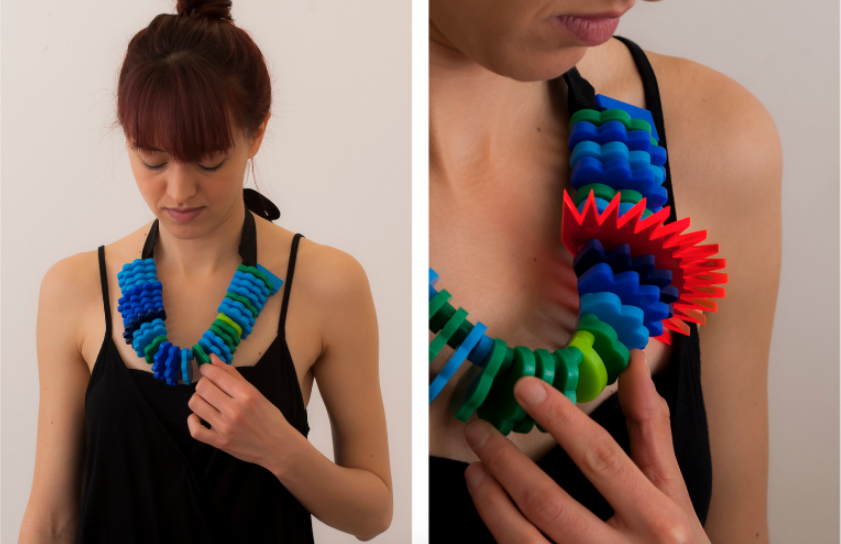
Air Transformed: Better with Data Society Commission
Stefanie Posavec and Miriam Quick
This project looks at how we can feel the burden of air pollution. The necklaces weigh heavy onto your chest, creating discomfort. Read more about it here.
Photo credit: Steve McInerny
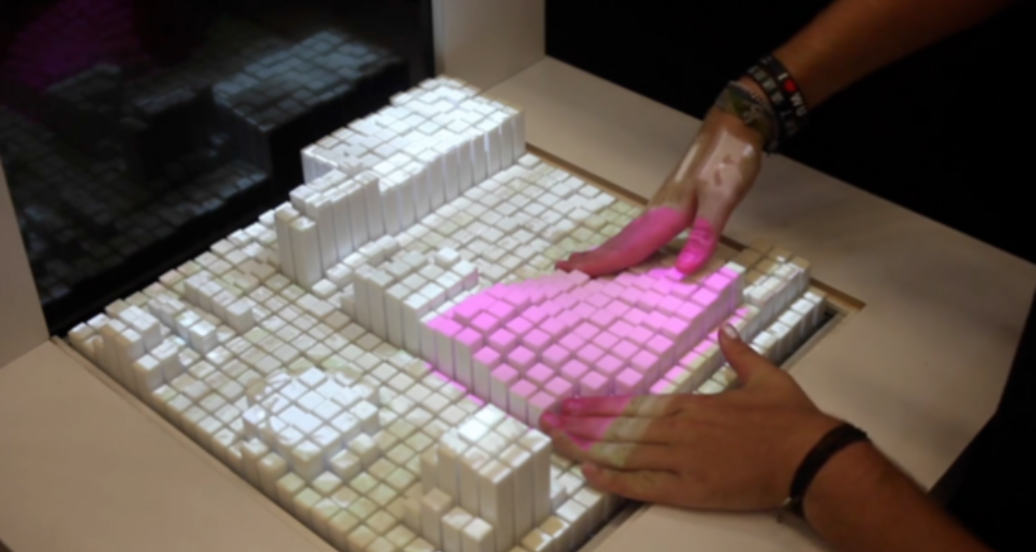
Materiable
Ken Nakagaki, Luke Vink, Jared Counts, Daniel Windham, Daniel Leithinger, Sean Follmer and Hiroshi Ishii
Shape changing interfaces give physical shapes to digital data so that users can feel and manipulate data with their hands and bodies. However, physical objects in our daily life not only have shape but also various material properties. In this project, we propose “Materiable,” an interaction technique to represent material properties using shape changing interfaces. Specifically, by integrating the multi-modal sensation techniques of haptics, our approach builds a perceptive model for the properties of deformable materials in response to direct manipulation without precise force feedback. Read more here.
Photo credit: Materiable Team
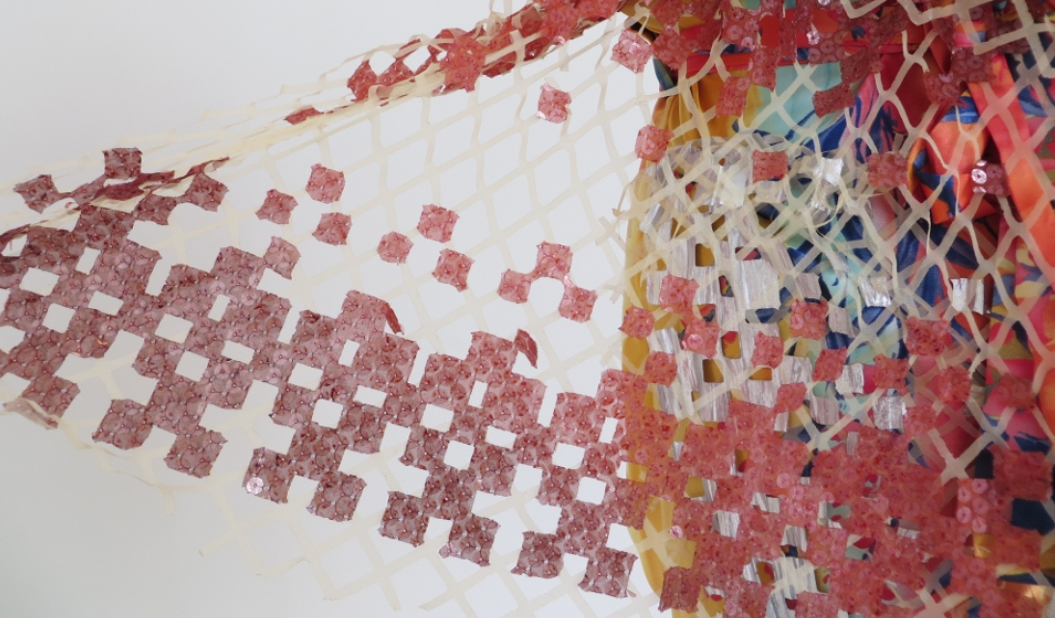
Dressed in Data
Michael Bove and Laura Perovich
Dressed in Data steps beyond data visualizations to create data experiences that engage not only the
analytic mind, but also the artistic and emotional self. Data is taken from a study of indoor air pollutants to create four outfits, each outfit representing findings from a particular participant and chemical class. Read more here.
Photo credit: Laura Perovich